Inspect the source
Review schemas, data types, nested application fields and source-table coverage.
Data analytics case study · Portfolio risk
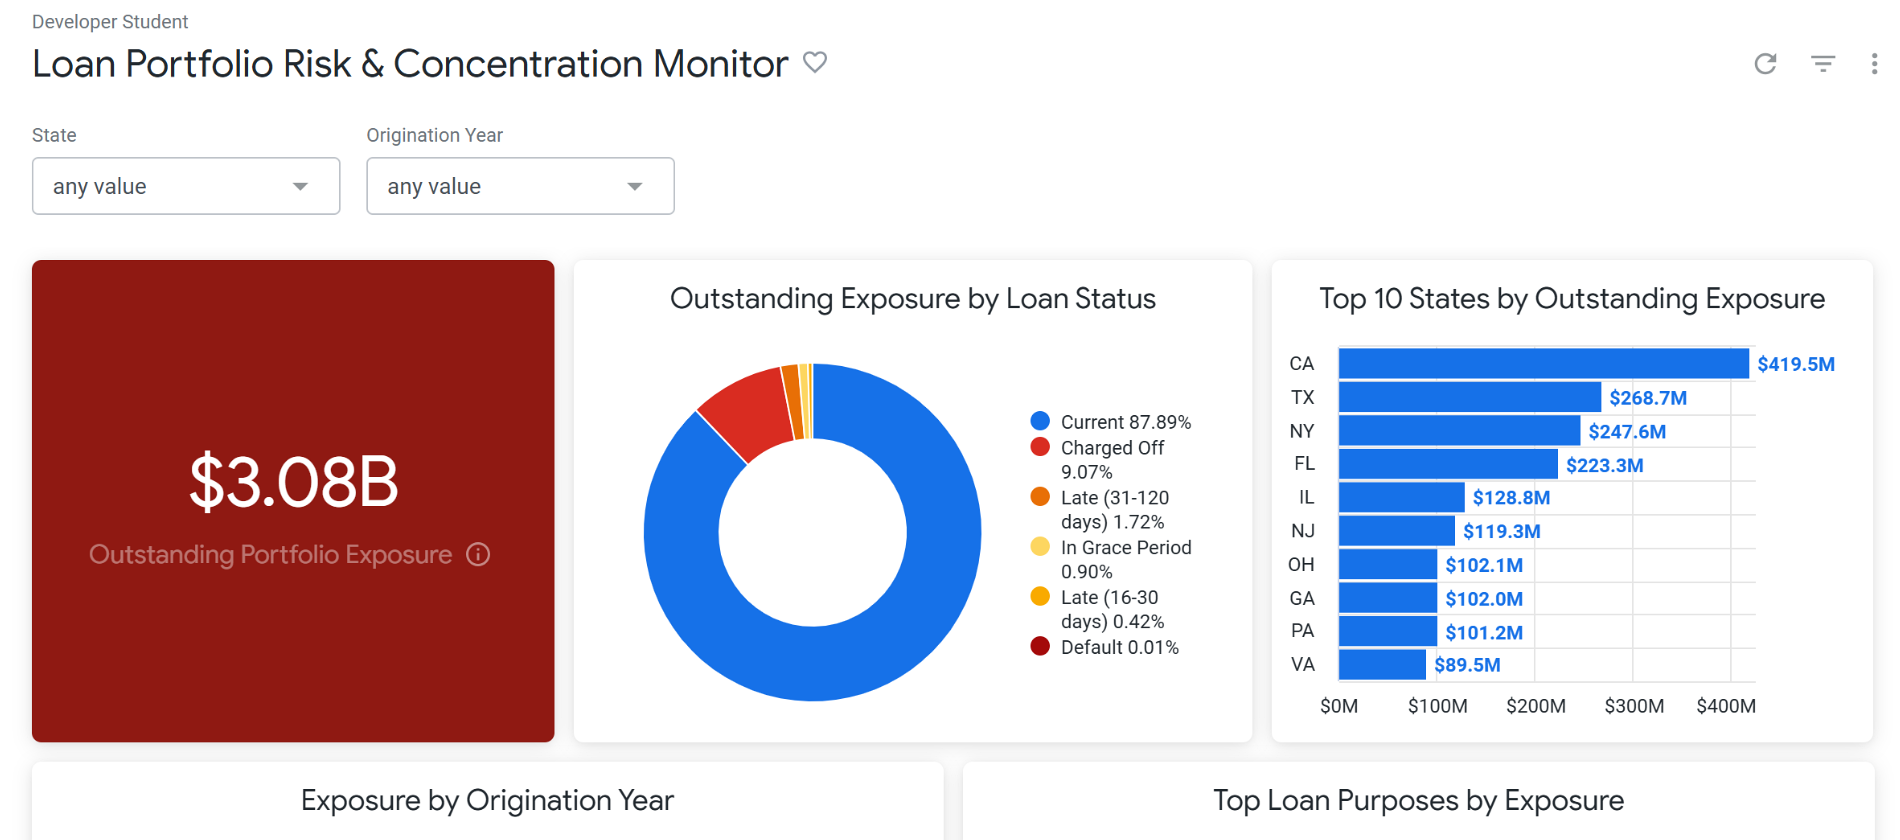
I used BigQuery and Looker Enterprise to validate 270,299 loan records, model exposure and loss signals, and design a monitoring framework that connects an executive alert to the geography, status, purpose and vintage behind it.
The balance exceeds the illustrative $3.00B threshold. The supporting measures show why the response cannot stop at the aggregate.
Above the illustrative $3.00B internal monitoring level.
Material geographic concentration across the largest state balances.
Debt consolidation dominates outstanding portfolio volume.
Small-business lending carries the highest observed purpose-level rate.
Looker Enterprise
The dashboard keeps the executive signal visible while cross-filtering reveals the states, years, purposes and borrower records behind it.
The image will appear when the corresponding site asset is available.
Risk lenses
Most displayed status exposure is current, but the portfolio still contains a material charged-off component and a delinquency pipeline that requires separate monitoring.
The current category holds most of the displayed status exposure. Charged-off and delinquent balances still require their own controls because their business meaning differs from the active portfolio.
Select a row to update the interpretation. Values come from the validated analytical outputs used in the project.
Method and data quality
The analysis begins with row-level validation and explicit risk definitions. Reusable marts then connect every executive measure to documented SQL and a traceable source grain.
BigQuery evidence
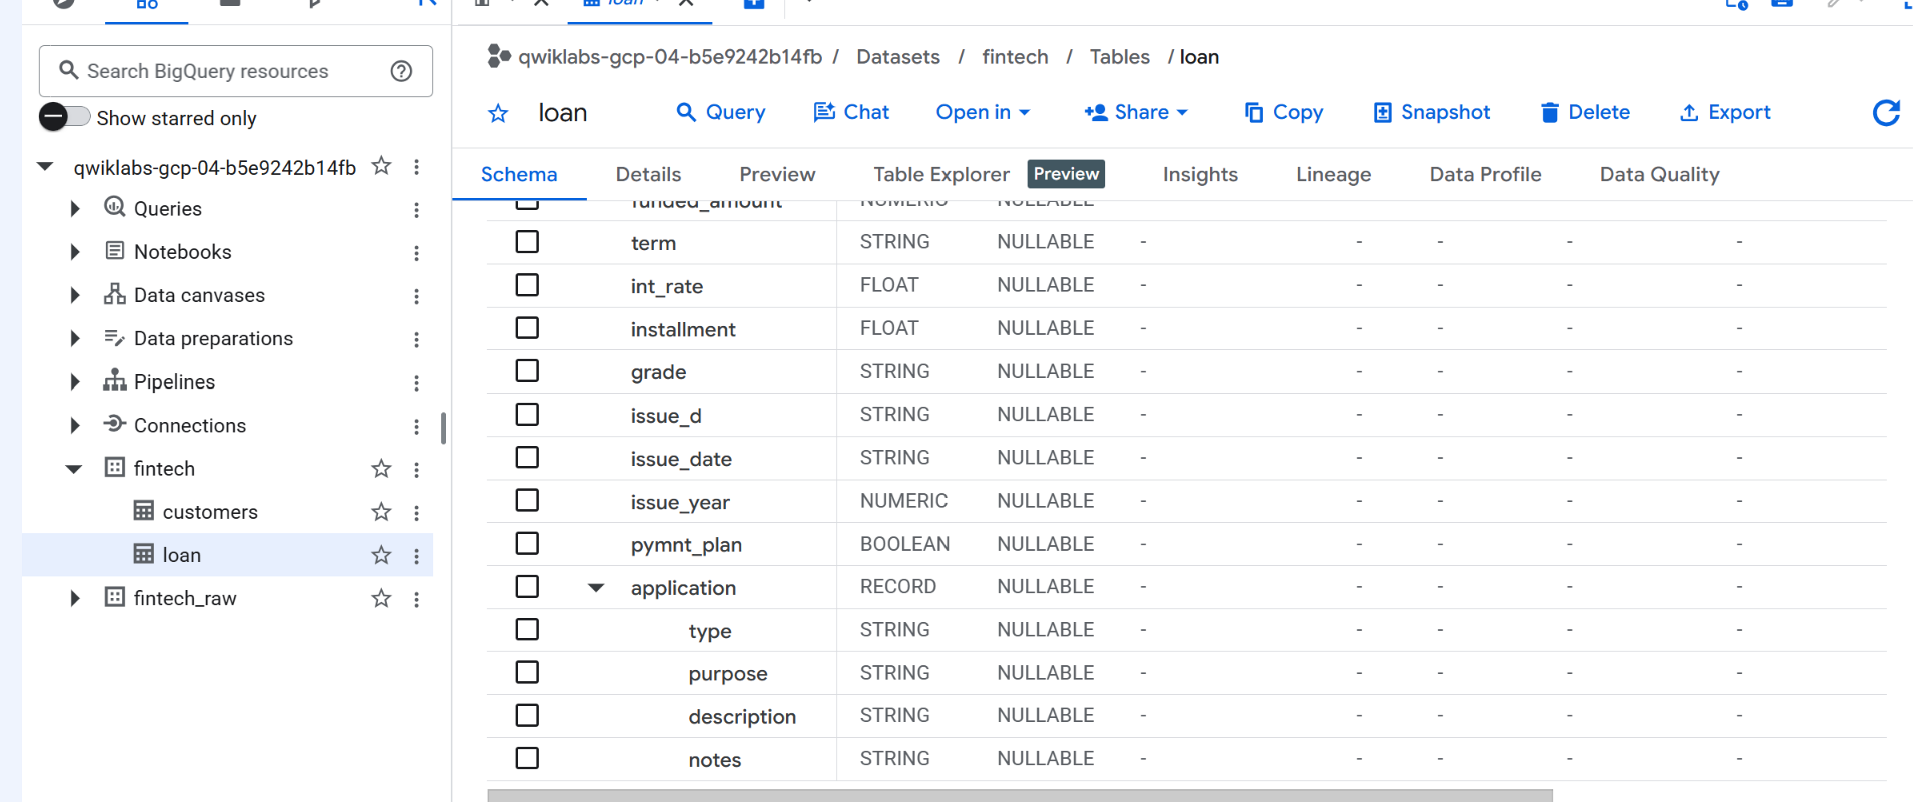
Schema inspection established the available fields, nested application structure and data types before transformation logic was written.
The image will appear when the corresponding site asset is available.
Review schemas, data types, nested application fields and source-table coverage.
Compare row counts with distinct loan IDs and test core fields and mappings.
Create explicit outstanding, delinquency and loss flags at loan level.
Aggregate statuses, states, regions, purposes, years and executive findings.
Connect the analytical layer to filters, cross-filtering and threshold formatting.
CREATE OR REPLACE TABLE fintech.loan_risk_mart AS
SELECT
  l.loan_id,
  l.customer_id,
  l.loan_status,
  l.loan_amount,
  l.state,
  sr.subregion,
  sr.region,
  l.int_rate,
  CAST(l.issue_year AS INT64) AS issue_year,
  COALESCE(l.application.purpose, 'Unknown') AS purpose,
  l.loan_status != 'Fully Paid' AS is_outstanding,
  l.loan_status IN (
    'Late (16-30 days)',
    'Late (31-120 days)',
    'In Grace Period'
  ) AS is_delinquent,
  l.loan_status IN ('Charged Off', 'Default') AS is_loss
FROM fintech.loan AS l
LEFT JOIN fintech.state_region AS sr
  ON l.state = sr.state;
Decision logic
The threshold becomes useful only when the same analytical layer explains which concentrations, segments and cohorts are driving the signal.
Outstanding exposure reached approximately $3.08B, above the illustrative $3.00B monitoring level. The breach should trigger investigation rather than a single undifferentiated response.
California holds about $419.53M in outstanding exposure. Together, the five largest states account for 41.81% of the portfolio.
Debt consolidation dominates outstanding exposure, while small-business loans have the highest observed purpose-level loss amount rate at 9.31%. They require different controls.
Outstanding exposure rose sharply for originations after 2015 and reached $796.72M for the 2019 cohort. Vintage analysis separates scale from changing performance.
Monitoring framework
The strongest operating model links the executive threshold to the concentration and segment measures that explain it, creating a direct path from signal to investigation.
Identify which years, states, statuses and purposes contribute most to the outstanding balance.
Monitor state share and the combined top-five exposure, then define review points for sustained increases.
Distinguish volume concentration from higher observed loss rates and add migration and vintage measures when time-series data becomes available.
Scope and interpretation
The project demonstrates a traceable analytical workflow and decision framework. Clear limitations prevent the portfolio snapshot from being interpreted as a live credit model.
It uses a training dataset and does not represent a live lender portfolio.
It is not a regulatory capital limit or a universal industry benchmark.
Alternative outstanding, delinquency or loss definitions would change the results.
Migration models, roll rates and repayment curves cannot be derived from this snapshot alone.
Project evidence
The public files separate analytical outputs, documented SQL and the concise hiring-level narrative.
Portfolio summary, yearly growth, purpose risk, state watchlist, regional status mix and borrower detail.
SQL · BigQuery scriptsSource validation, geographic mapping, risk-mart creation, executive summaries and analytical queries.
PDF · Executive summaryBusiness context, method, principal findings, recommendations and project limitations.
Contact
I combine analytical discipline with multilingual SEO and editorial judgement to turn evidence into decisions people can act on.