Analytics · Business intelligence · Data quality

Data analytics projects

Three documented case studies connect data quality, analytical modelling and business interpretation across portfolio risk, market opportunity and contact-centre operations. Explore my contribution, the delivered outputs and the evidence behind each recommendation.

Analytical deliverables

From data to usable evidence

Source data connects to three analytical outputs: a SQL layer, an Excel workbook and a BI report. Source data SQL layer Workbook BI report
Also explore search and AI evaluation

Public case studies

Selected analytics projects

Each study makes its methods, findings and downloadable outputs available for review. The three cases address different questions and data sources.

BigQuery → Looker

From source to risk mart
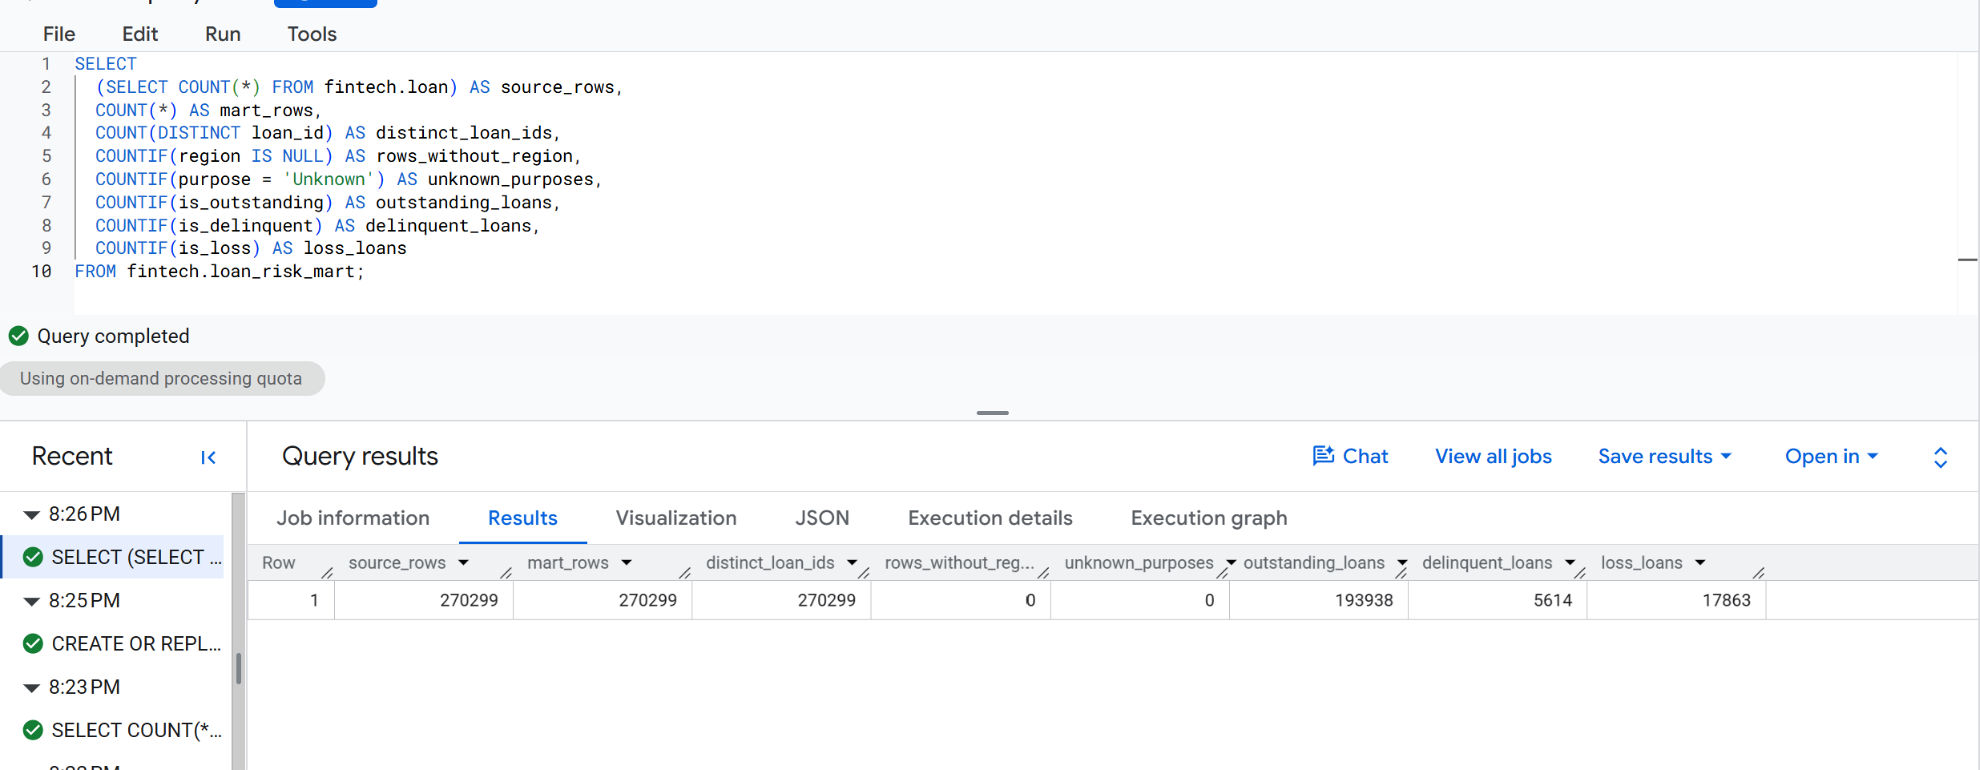
BigQuery validation showing 270,299 source rows, risk-mart rows and distinct loan IDs, with no missing regions or unknown purposes Open image

Source rows, mart rows and distinct IDs reconcile before the reporting layer is built.

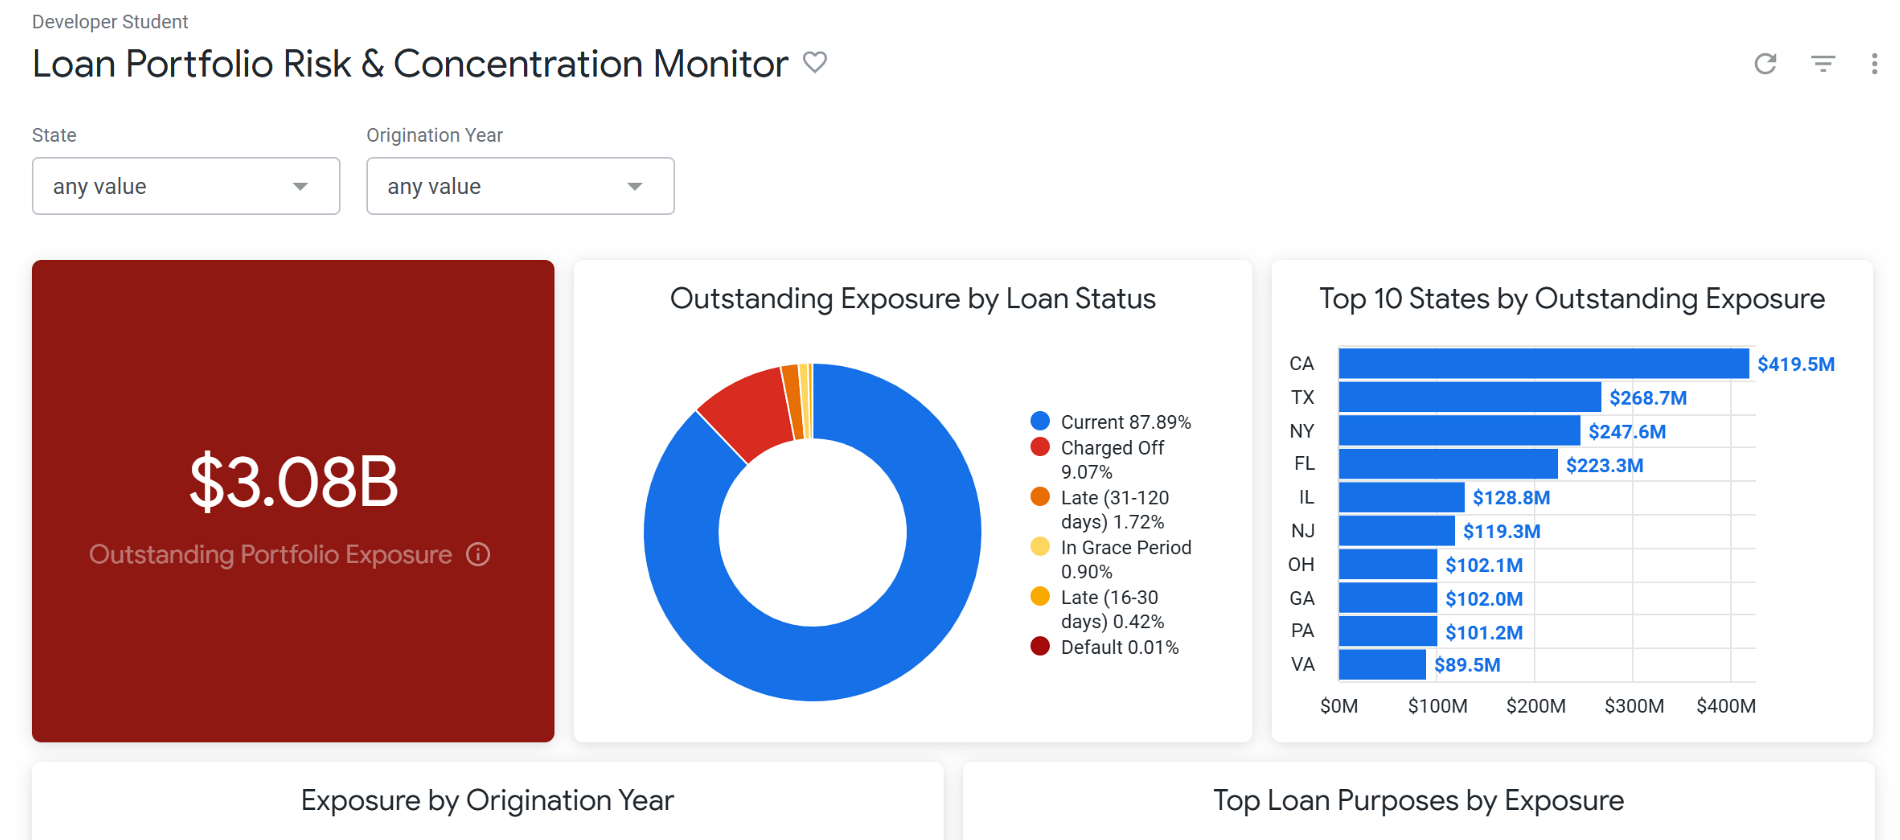
Looker dashboard connecting portfolio exposure, loan status and geographic concentration Open image

The same analytical layer supports exposure, status and geographic investigation.

7reusable analytical tables behind the monitoring experience

01 Portfolio risk analytics

Loan portfolio risk and concentration

How can a reviewer trace an exposure alert back to the segments behind it? I checked the source grain, defined risk flags and built reusable tables in BigQuery, then connected them to an interactive Looker monitoring layer.

Delivered
Documented SQL, validation outputs and a portfolio monitoring dashboard.
Decision
Connect the portfolio alert to loan status, geographic concentration, purpose and origination cohort.

Training dataset · Illustrative internal monitoring threshold

  • SQL
  • BigQuery
  • Looker Enterprise
  • Data modelling

Further evidence in the case study: CSV exports and PDF summary

Excel · Cross-market analysis

The comparison behind the recommendation

Keyword_CleanCrosswalkQA_Log

Non-brand share of estimated monthly searches

213clean keyword rows, alongside 125 competitor ranking rows

02 Market opportunity analytics

SEO market opportunity analysis

Which market offers the strongest opportunity for a new travel vertical? I standardised keyword and ranking exports, separated branded and non-brand demand, and compared intent and competitors across Spain, France and the United Kingdom.

Delivered
An Excel workbook with cleaned tables, a crosswalk, a QA log and reproducible SQL examples.
Decision
Recommend France for the initial launch, followed by Spain and a selective UK pilot.

Directional recommendation based on sampled keywords, rankings and estimated monthly search volumes

  • Excel
  • Data cleaning
  • Market segmentation
  • Competitive analysis

Further evidence in the case study: PDF summary and market comparisons

Power BI · Survey sensitivity

Test the scoring assumption

Net Promoter Score · Same captured records

Including valid zeros is the main policy; excluding them tests a definition choice using the same captured data.

03 Operational service analytics

Contact centre performance in Power BI

A reliable service review needs explicit rules for AI endpoints, human attention and abandonment. I reconciled 197,278 interactions and built a Power BI reporting model with routing definitions, period comparisons and feedback sensitivity checks.

Delivered
A Power BI monitoring model, metric definitions and anonymised aggregate evidence.
Decision
Investigate Customer Support queues and Sales transfer losses, and confirm survey coding before using scores as targets.

Public adaptation of a practical case using anonymised aggregates · Recommendations await operational validation

  • Power BI
  • Data modelling
  • Outcome reconciliation
  • Survey analysis

Further evidence in the case study: PDF summary and metric dictionary

Applied evaluation

Search and AI evaluation

Alongside the public case studies, my professional evaluation work applies detailed guidelines and task-specific quality criteria across languages and markets.

Multilingual search quality

Search relevance and intent

I assessed query intent, result usefulness, language and market context against detailed search-quality guidelines.

My contribution: relevance assessment, language-quality review and consistent documentation of edge cases.

  • TELUS Digital
  • Lionbridge
  • Appen
  • Leapforce
AI data quality

Response accuracy and quality

I evaluated generated and structured responses for factual consistency, reasoning, language quality and compliance with task requirements.

My contribution: comparing outputs, identifying errors and documenting written justifications against the applicable criteria.

  • Outlier
Explore evaluation experience in the data profile

How I structure the work

A traceable analytical process

The project evidence makes each stage visible, from source definitions and validation to the recommendation and its limits.

  1. Define

    Set the business question, source grain and metric definitions.

    Portfolio definitions
  2. Validate

    Reconcile records, mappings and calculations before interpreting results.

    SQL validation
  3. Analyse

    Compare segments and test the assumptions that affect the finding.

    Market comparisons
  4. Recommend

    Connect the evidence to an action, scope and useful next step.

    Operational priorities

Continue exploring

Explore related work

See the experience supporting these studies, or explore the wider project portfolio.

Contact

Need a clearer answer from complex data?

Get in touch about a role or project involving analysis, reporting or data quality.